
Current Projects
-
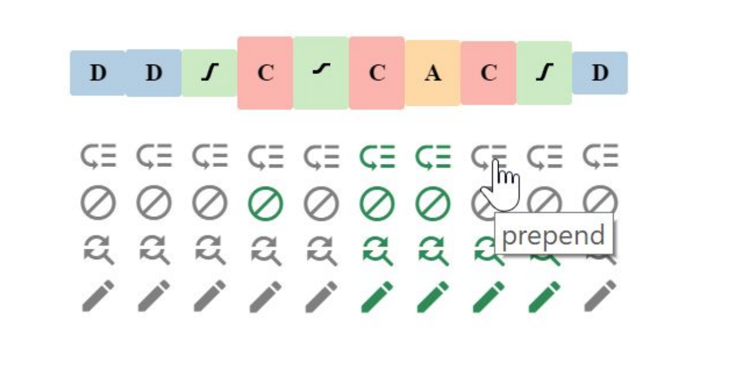
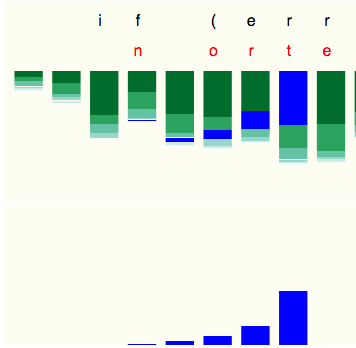
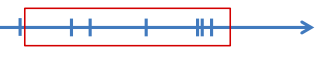
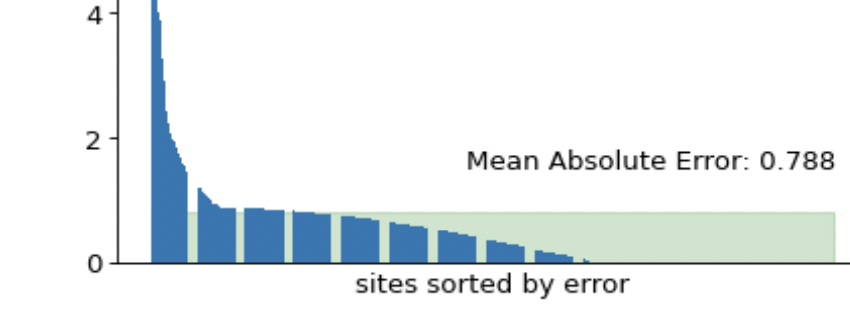
Tactile Graphics for Blind and Low Vision People
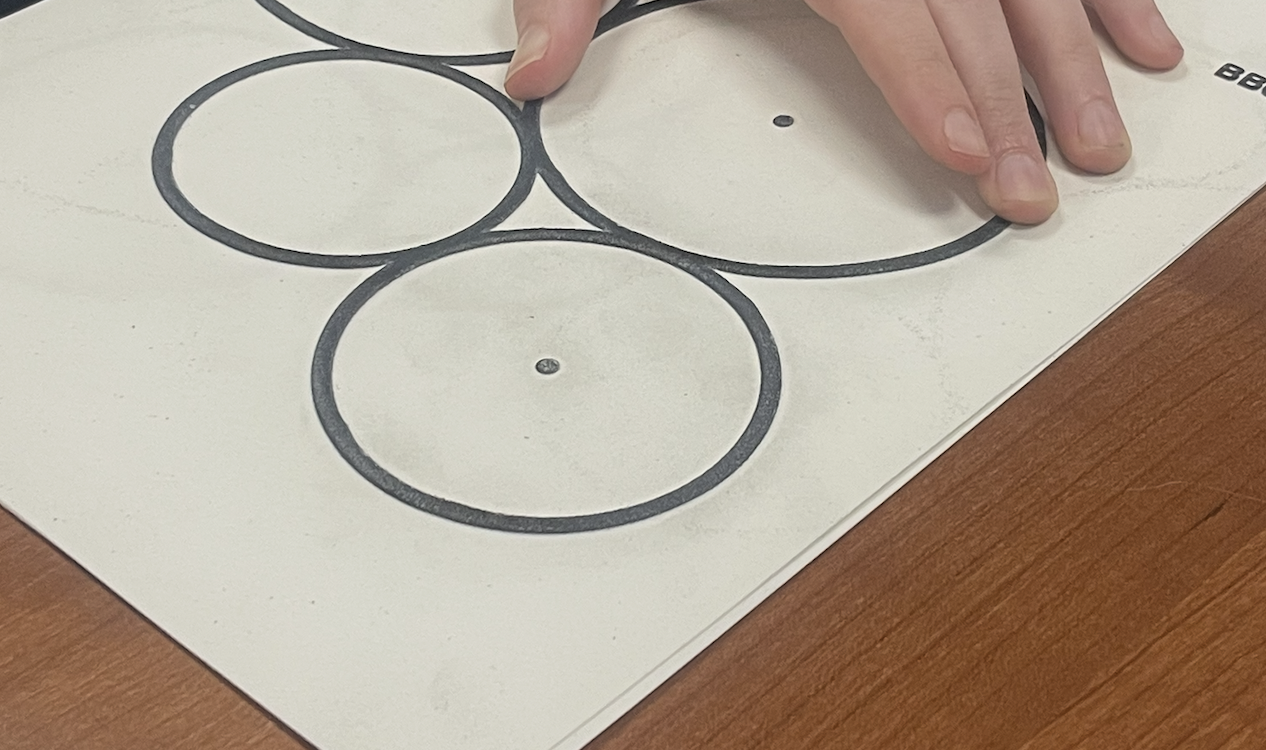
Tactile graphics are an increasingly common medium for the communication of data, and recent technological advancements such as braille embossers and refreshable tactile displays are rendering them more accessible for occupational and educational use cases for the blind and low vision community. In addition, with the continued progression of ubiquitous and wearable computing, tactile graphics will likely become a more common interface in mass market consumer devices. In our work with scholars from the blind and low vision technology research community, we investigate fundamental questions in the perception of tactile graphics, including the measurement and characterization of error, and the physical strategies employed by blind and low vision people.
-
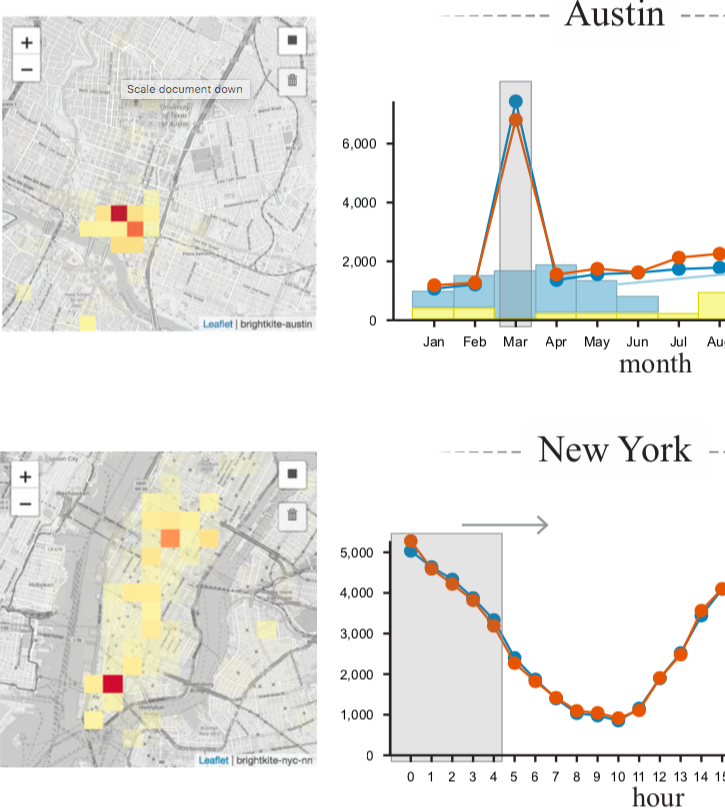
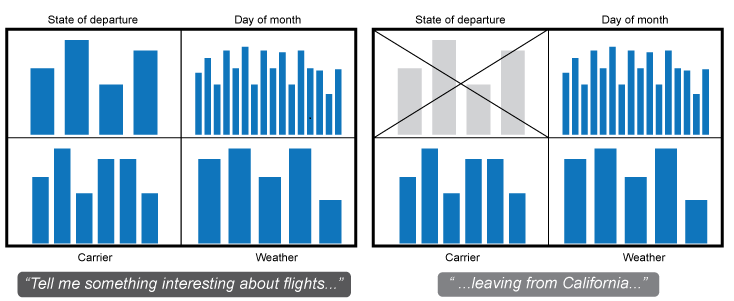
Automated Generation of Context-aware data using Data Flow Graphs
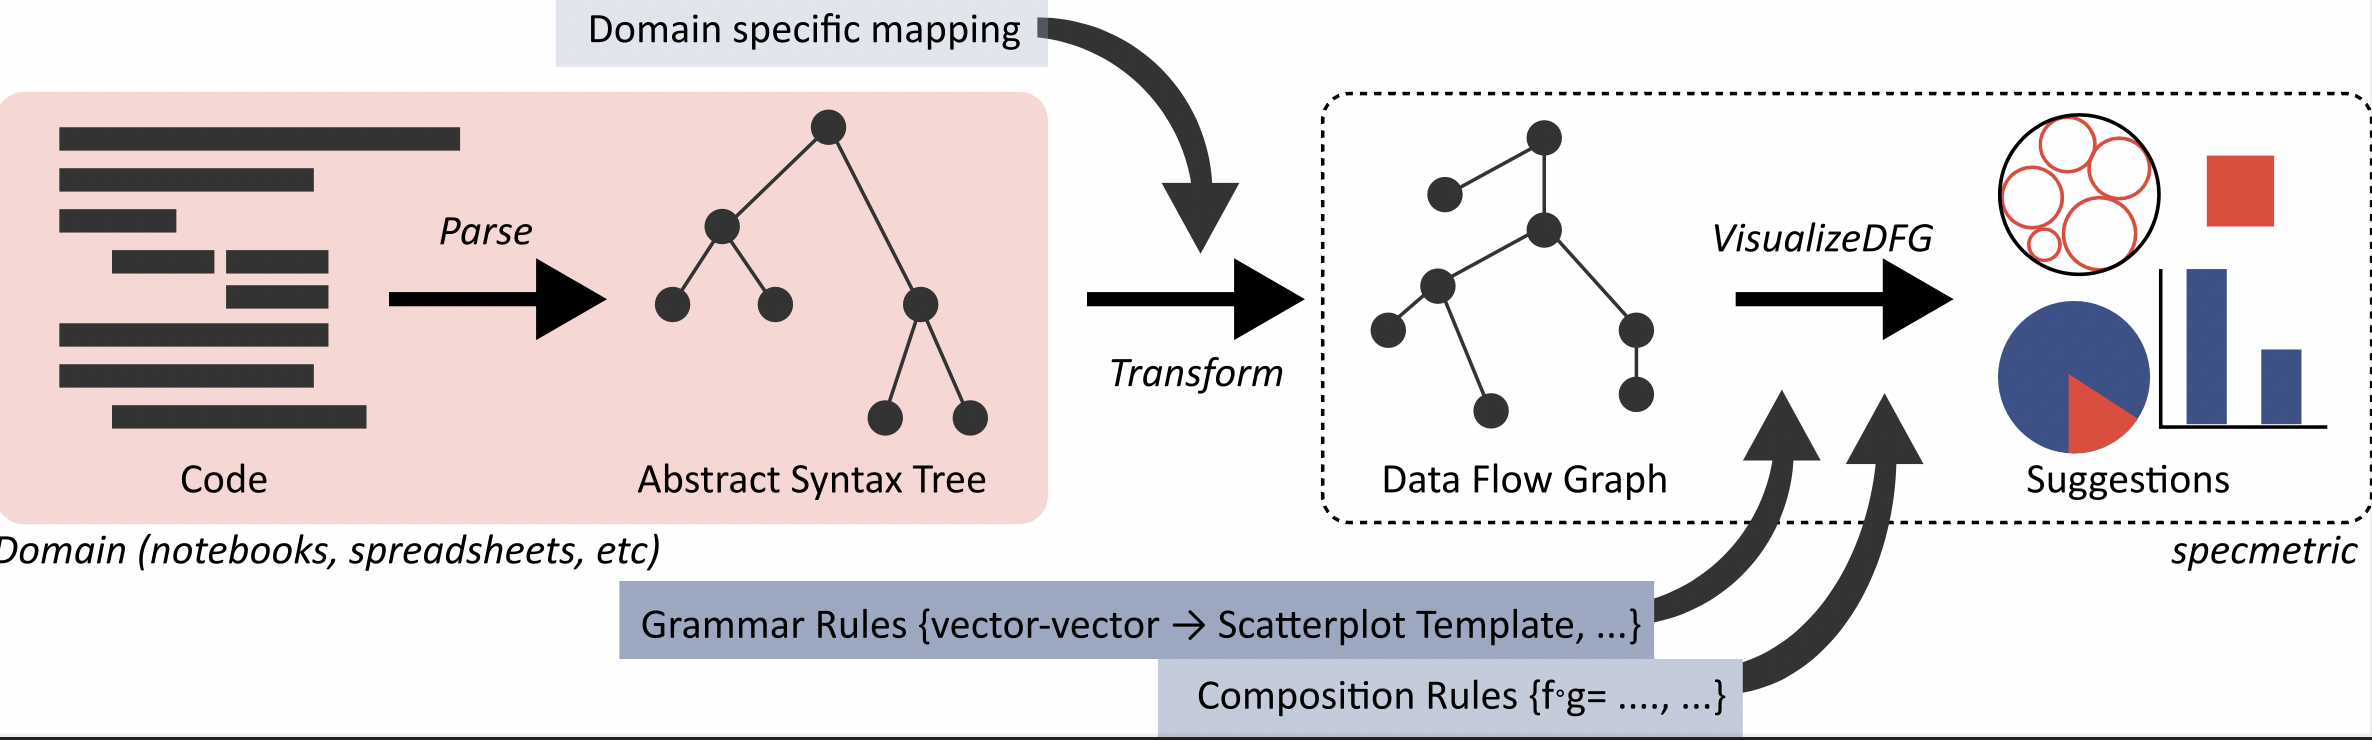
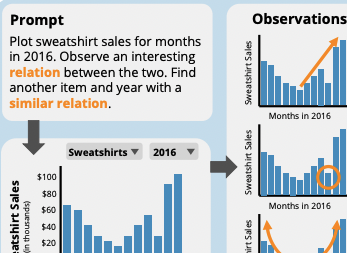
Automatically generated visualizations can allow any user to generate a relevant, clear, and useful visualization based on the data types present in the dataset. However, data often goes through several transformations between its raw values and the ultimate target of the analysis. Statistical analysis is a good example of this - data is transformed, fit to a model, and then aggregated into a single metric such as the regression coefficient. Viewing just the data or just the calculated regression coefficient doesn't tell the whole story. In my work, I parse data transformation functions, which can be derived from the abstract syntax tree (AST) of a program, in order to infer additional visualization recommendations. This can be used to generate a sequence of linked visualizations that tell the story behind a data flow program.
Currently in progress. Come back soon!
Selected Publications
-
A. Khalaila, L. Harrison, N.W. Kim, D. Cashman. "They Aren't Built For Me": An Exploratory Study of Strategies for Measurement of Graphical Primitives in Tactile Graphics. IEEE Transactions on Visualization and Computer Graphics, 2025.
Best Paper Award (top 1% of submitted papers)
-
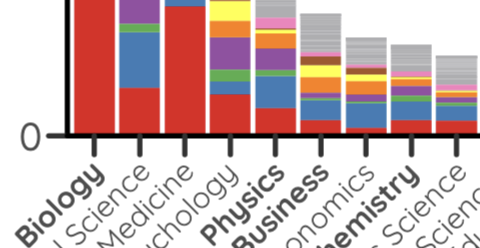
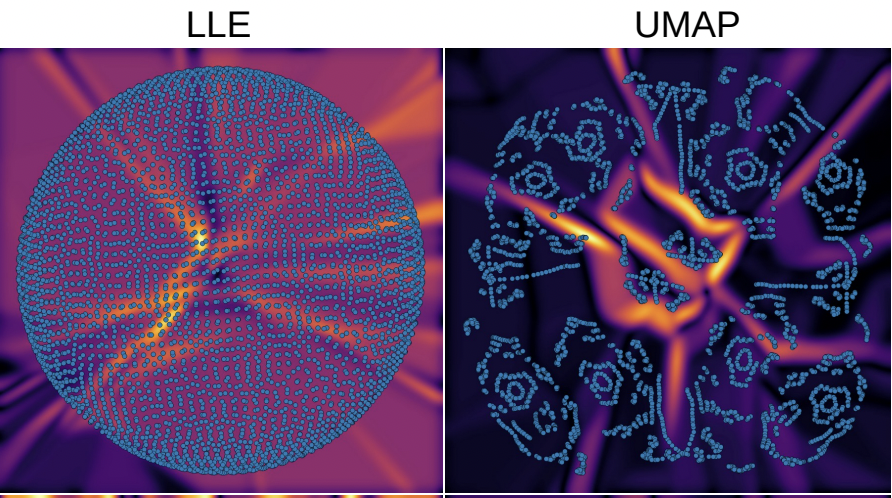
D. Cashman, M. Keller, H. Jeon, B.C. Kwon, Q. Wang. A Critical Analysis of the Usage of Dimensionality Reduction in Four Domains. IEEE Transactions on Visualization and Computer Graphics, 2025.
-
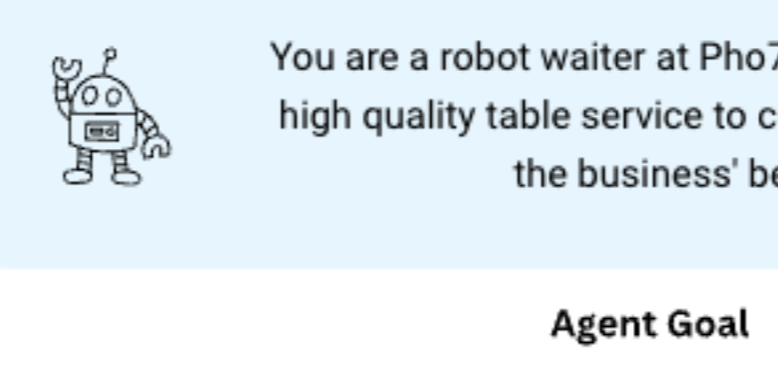
S. George, C. Sypherd, and D. Cashman. Probing the Capacity of Language Model Agents to Operationalize Disparate Experiential Context Despite Distraction. EMNLP Findings, 2024.
-
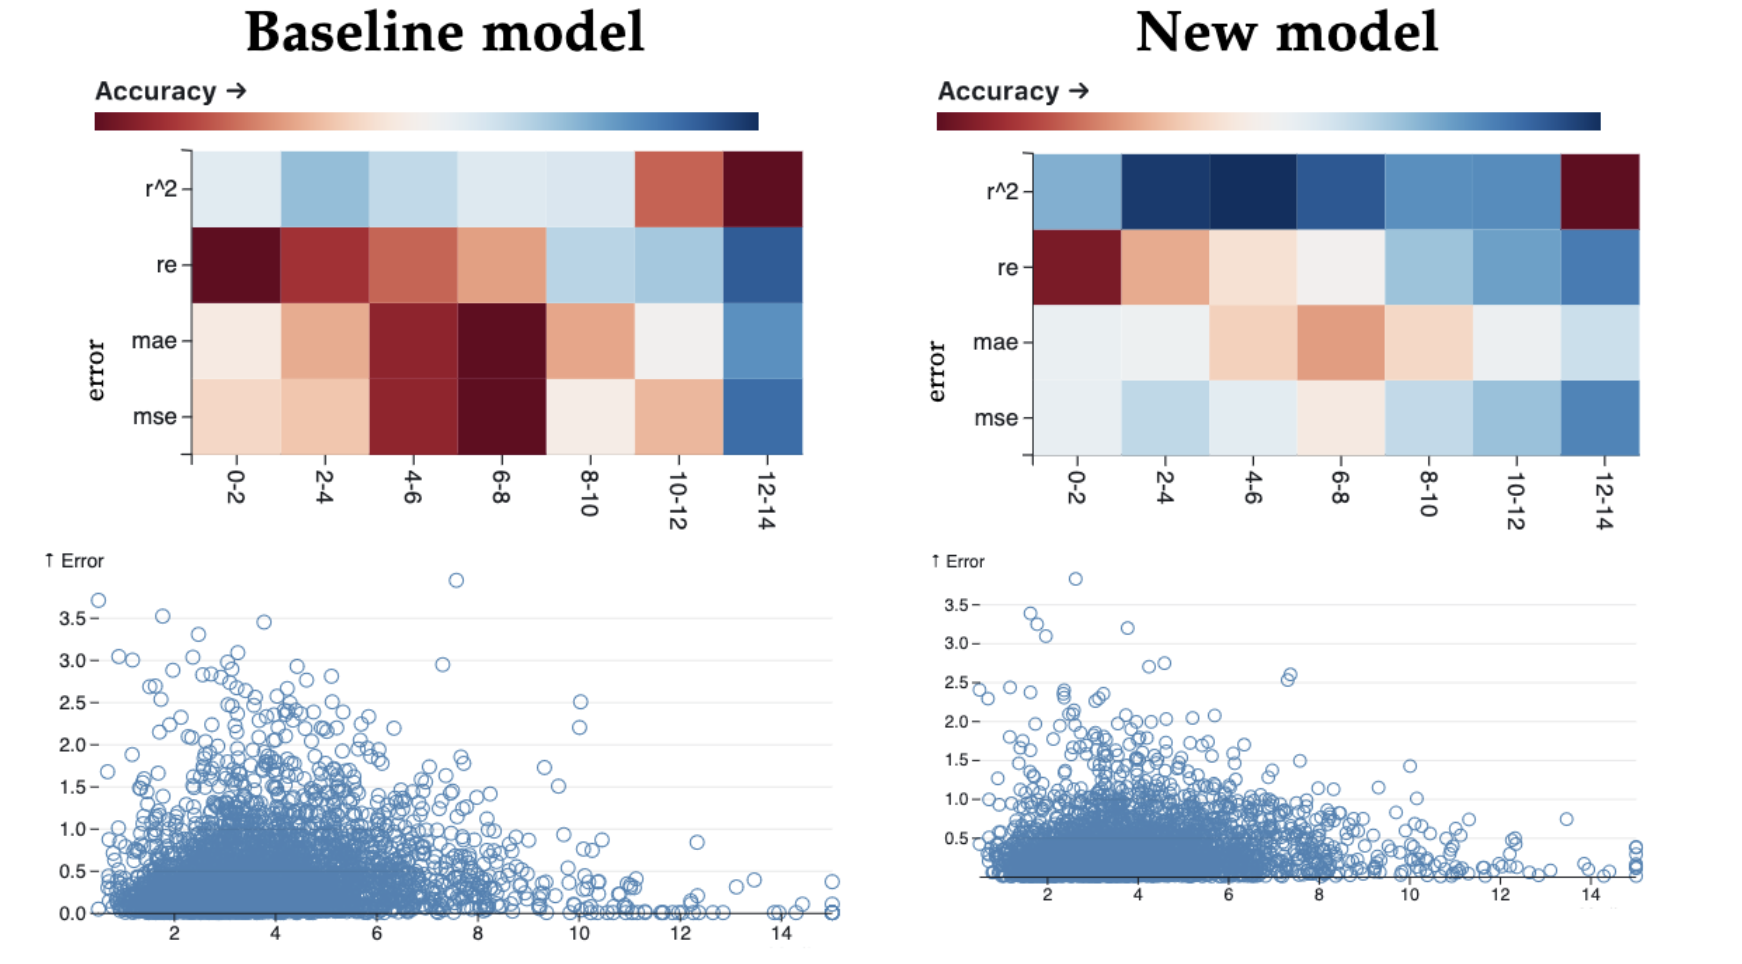
A. Suh, G. Appleby, E.W. Anderson, L. Finelli, R. Chang, D. Cashman. Are Metrics Enough? Guidelines for Communicating and Visualizing Predictive Models to Subject Matter Experts. IEEE Transactions on Visualization and Computer Graphics, 2023.
-
A. Suh, A. Mosca, S. Robinson, Q. Pham, D. Cashman, A. Ottley R. Chang. Inferential tasks as an evaluation technique for visualization. EuroVis Short Papers, 2022.
-
M. Espadoto, G. Appleby, A. Suh, D. Cashman, M. Li, C. Scheidegger, E. W. Anderson, R. Chang, A. C. Telea. Unprojection: Leveraging inverse-projections for visual analytics of high-dimensional data. Transactions on Visualization and Computer Graphics (TVCG), 2021.
-
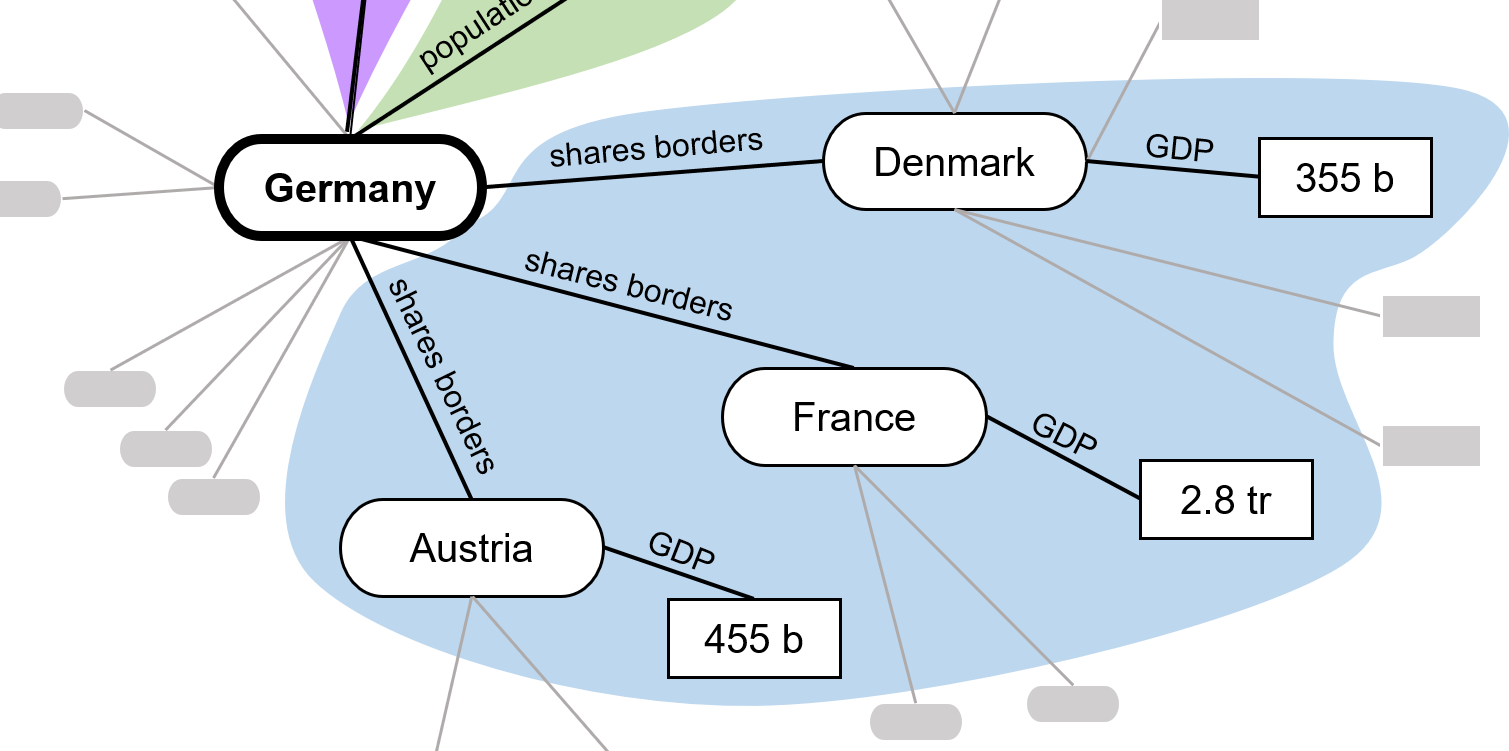
D. Cashman, S. Xu, S. Das, F. Heimerl, C. Liu, S. Humayoun, M. Gleicher, A. Endert, R. Chang. CAVA: A Visual Analytics System for Exploratory Columnar Data Augmentation Using Knowledge Graphs. Transactions on Visualization and Computer Graphics (TVCG), 2020.
-
D. Cashman, A. Perer, R. Chang, H. Strobelt. Ablate, variate, and contemplate: Visual analytics for discovering neural architectures. Transactions on Visualization and Computer Graphics (TVCG), 2019.
-
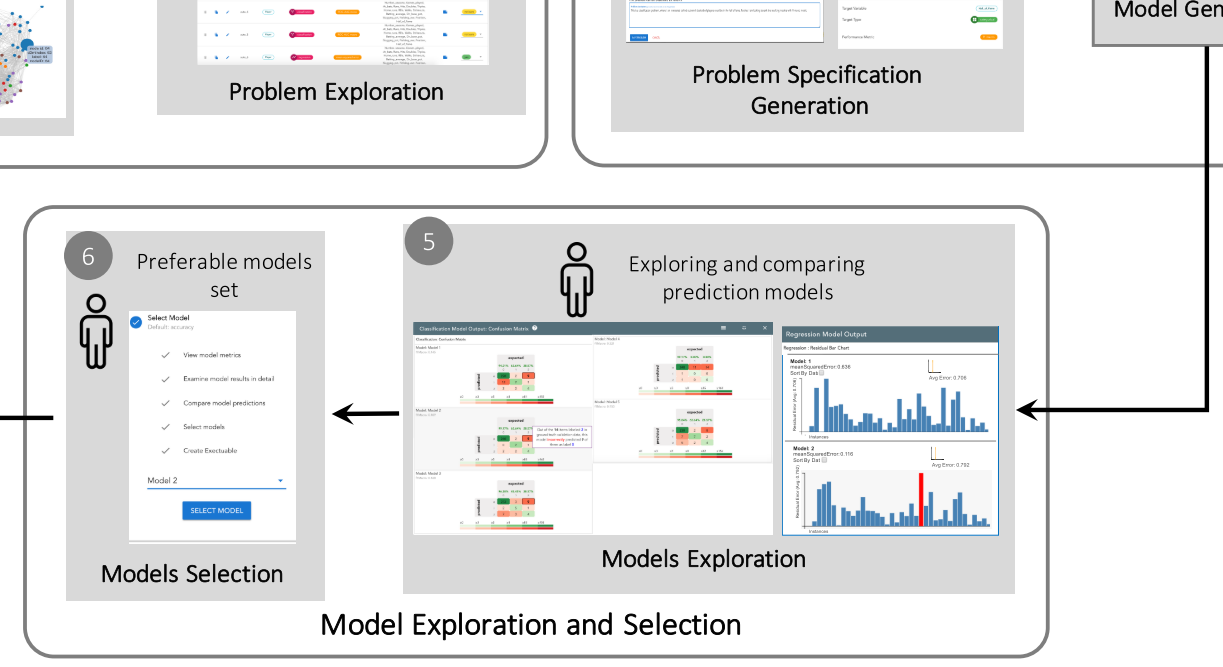
D. Cashman, S. Humayoun, F. Heimerl, K. Park, S. Das, J. Thompson, B. Saket, A. Mosca, J. Stasko, A. Endert, M. Gleicher, R. Chang. A User-based Visual Analytics Workflow for Exploratory Model Analysis. Computer Graphics Forum (CGF), 2019.
-
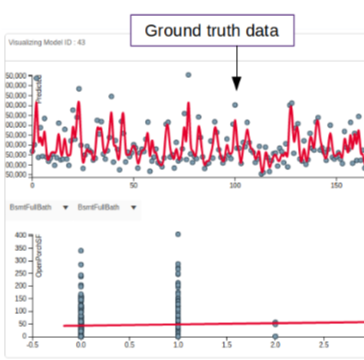
S. Das, D. Cashman, R. Chang, A. Endert, "BEAMES: Interactive Multi-Model Steering, Selection, and Inspection for Regression Tasks " Symposium on Visualization in Data Science (at IEEE VIS), 2018.
-
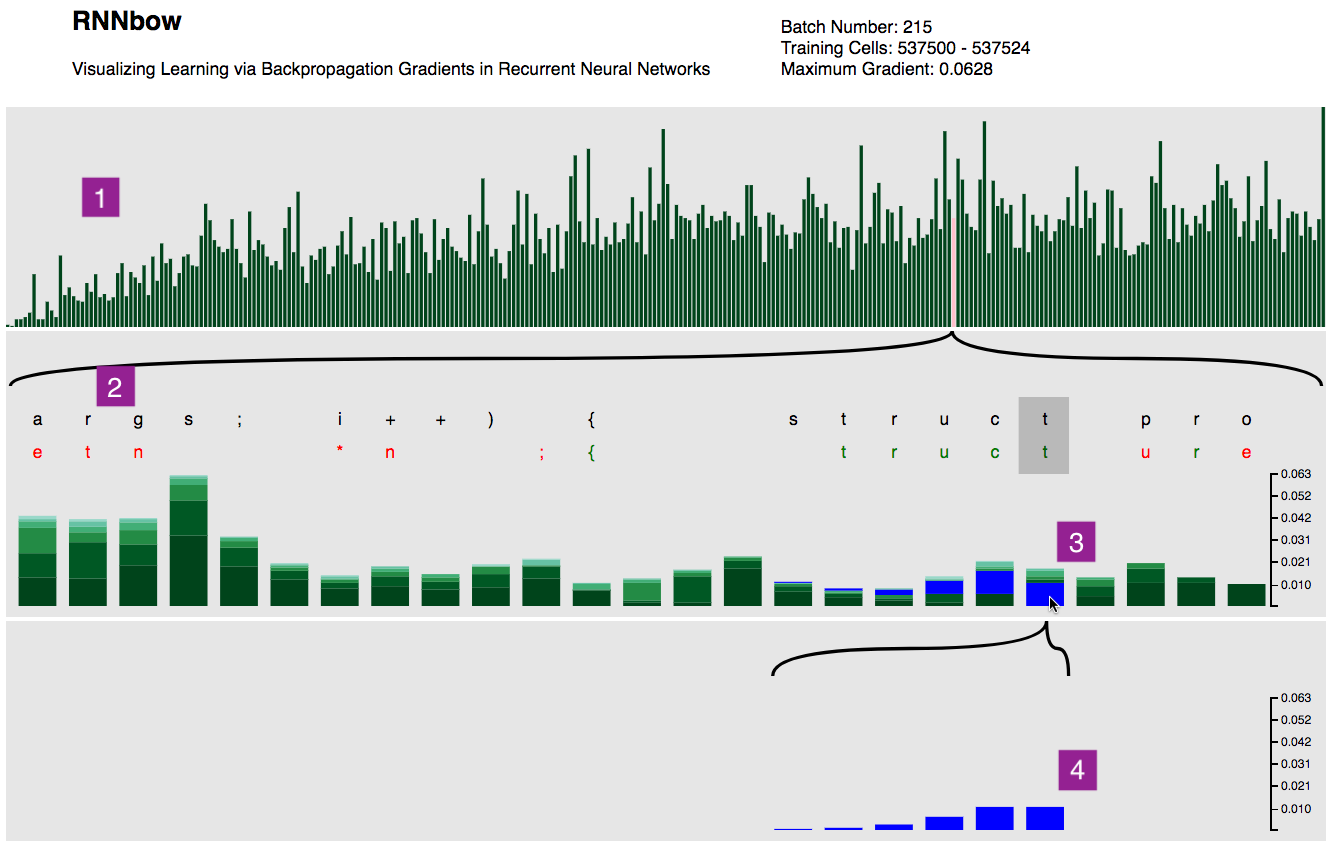
D. Cashman, G. Patterson, A. Mosca, N. Watts, S. Robinson, R. Chang, "RNNbow: Visualizing Learning via Backpropagation Gradients in RNNs" IEEE Computer Graphics and Applications, 2018.
D. Cashman, G. Patterson, A. Mosca, R. Chang, "RNNbow: Visualizing Learning via Backpropagation Gradients in Recurrent Neural Networks" Workshop on Visual Analytics for Deep Learning (at IEEE VIS), 2017.
Best Paper Award
-
B. Price, L. Price, D. Cashman, M. Nabi, "Efficient Bayesian Detection of Disease Onset in Truncated Medical Data" IEEE International Conference on Healthcare Informatics, 2017.
Posters and Workshop Papers
-
A. Suh, G. Appleby, E. W. Anderson, L. Finelli, D. Cashman, "Communicating performance of regression modelsusing visualization in pharmacovigilance." Workshop on Visual Analytics in Healthcare at IEEE VIS, 2021.
D. Cashman, Y. Wu, R. Chang, A. Ottley, "Inferential Tasks as a Data-Rich Evaluation Method for Visualization" Workshop on Evaluation of Interactive Visual Machine Learning Systems at IEEE VIS, 2019.
B. Kang, D. Cashman, R. Chang, J. Lijffijt, T. De Bie, "CLIPPR: Maximally Informative CLIPped PRojections with Bounding Regions" Posters for IEEE Conference on Visual Analytics for Science and Technology, 2018.
D. Cashman, S. Kelley, D. Staheli, C. Fulcher, M. Procopio, R. Chang, "Big Data, Bigger Audience: A Meta-algorithm for Making Machine Learning Actionable for Analysts" Posters for VizSec, 2016. Also presented at MIT Lincoln Labs Cyber and Netcentric Workshop CNW 2017
Awards
-
Best Paper (top 1% of submitted papers), IEEE VIS Full Papers, Vienna, Austria, November 2025.
-
Best Paper, EuroVis Short Papers, Rome, Italy, June 2022.
-
Best Paper, Symposium on Visualization for Data Science, IEEE Conference on Visualization, Berlin, Germany, October 2018.
-
3rd Place, Tufts Graduate Research Symposium, Tufts University, 2018.
-
Best Paper, Workshop on Visual Analytics for Deep Learning, IEEE Conference on Visualization, Phoenix, AZ, October 2017.
-
Provost's Fellowship, Tufts University, 2016-present.
Talks
-
D. Cashman, "Towards the Generation of Descriptive and Accessible Data Representations for Data Science and AI" University of Utah , 2025
-
D. Cashman, "Improving the Impact of AI with Visual Affordances" University of Victoria , 2023
-
D. Cashman, "Machine Learning for Visualization" Washington University in St. Louis , 2021
-
D. Cashman, "Bridging the Human-Machine Gap in Applied AI with Visual Analytics" Pacific Northwest National Lab , 2021
-
D. Cashman, "Value of Visual Analytics for Insights, Strategy, and Design" Novartis Institute for Biological Research , 2020
-
D. Cashman, "Model Selection for Data Scientists" MATLab Deep Learning Tea, 2019
-
D. Cashman, G. Patterson, A. Mosca, N. Watts, S. Robinson, R. Chang, "RNNbow: Visualizing Learning via Backpropagation Gradients in Recurrent Neural Networks" Tufts Graduate Research Symposium , 2018
3rd Place
-
D. Cashman, F. Yang, J. Chandler, A. Mosca, M. Iori, T. August, R. Chang, "Chasing Waldo: Implicit Recovery of User Behavior and Intent from User Interaction Logs" Tufts Graduate Research Symposium , 2017
-
D. Cashman, "Color Spaces and Color Places" Tufts REU Lecture Series , Summer 2017
-
D. Cashman, "Big Data, Bigger Audience: A Method for Adapting Statistical Methods for a Wider Audience of Users" Tufts IGNITE , 2015
-
D. Cashman, "Introduction to Ruby" and "Models, Scaffolding, and Migrations", Railsbridge Boston , 2013
Teaching
Lecturer / Professor
- COSI 212b: Interactive Machine Learning. (15 students) Brandeis University.
- COSI 104a: Introduction to Machine Learning. (75 students) Brandeis University.
- COSI 125a: Human Computer Interaction (75 students) Brandeis University.
- COSI 116a: Information Visualization. (90 students) Brandeis University.
- COSI 12b: Advanced Programming Techniques in Java. (50 students) Brandeis University.
- COSI 21a: Data Structures and the Fundamentals of Computing. (50 students) Brandeis University.
- DS 4200: Information Presentation and Visualization. (60 students) Northeastern University.
Guest Lecturer
- COMP 150VA: Visual Analytics Tufts University. Fall 2019
Teaching Assistant
- COMP 40: Machine Structure and Assembly Language Programming. Tufts University. Fall 2016, Spring 2017
- COMP 61: Discrete Math. Tufts University. Fall 2015
- Math 0520: Linear Algebra. Brown University. Spring 2008
- Math 0200: Multivariable Calculus. Brown University. Fall 2008, Fall 2009
- Math 0190: Calculus II. Brown University. Fall 2007
Hobbies
I used to play classical upright bass; I still play guitar sometimes. I'm a big music guy and I try to constantly expand what I'm listening to, both in genre and in time period. I like reading and I try to alternate between something fun and something important. My brothers and cousins and I all have a scheduled night every two weeks to play some dumb online videogames together. I was really into pickup basketball, but I'm afraid I'll hurt my knees if I play too frequently.
Oh, and watching TV series over and over again. Way too many times.